🔍 Overview
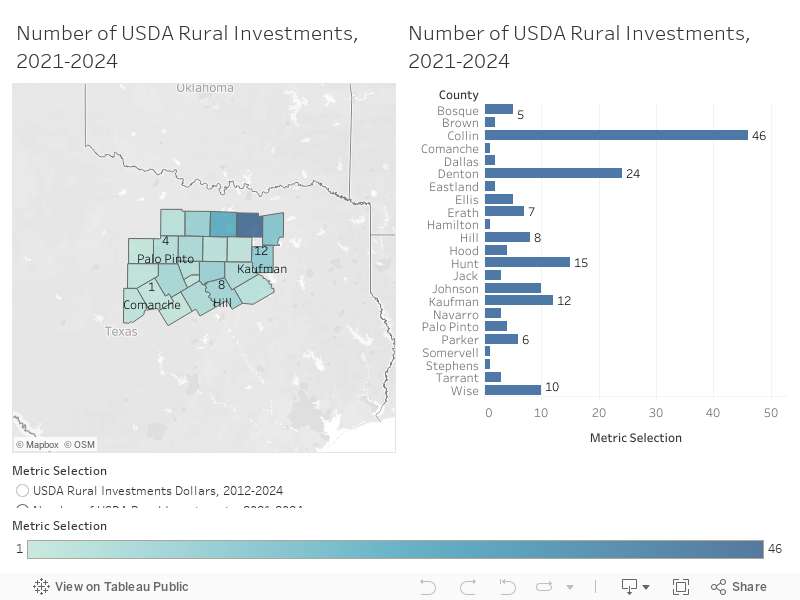
This Tableau dashboard visualizes the number of investments distributed across 24 counties. The data is presented on a geographic heatmap, where:
✅ Darker shades represent higher investment counts.
✅ Lighter shades represent lower investment counts.
This visualization enables quick insights into investment distribution trends across different counties.
🎯 Key Features
🔹 📍 Geographic Representation – A county-level map that helps analyze investment patterns.
🔹 📊 Investment Count Labels – Each county is labeled with its exact investment count.
🔹 🎛️ Interactive Filters:
- 📅 Year Filter (2012–2024): Allows users to select a specific year or view all years combined.
- 📈 Metric Selection: Currently set to “Number of Investments”, with flexibility to switch metrics.
🔹 🎨 Color Gradient Scale – A legend at the bottom provides a visual cue for investment intensity (light = low, dark = high).
📌 Key Insights
🔺 Highest Investment County: Collin County leads with 46 investments.
🔺 Significant Investment Counties:
- Denton (24)
- Hunt (15)
- Kaufman (12)
- Wise (10)
🔻 Lower Investment Counties: - Comanche, Stephens, and Somervell have only 1 investment each.
🔹 Overall Trend: Investments are unevenly distributed, with some counties receiving significantly more funding than others.
🚀 Potential Use Cases
✅ 📈 Investment Strategy Planning – Identify high- and low-investment areas to optimize resource allocation.
✅ 🏢 Economic Development Analysis – Assess regional economic growth trends over time.
✅ 💰 Investor Decision-Making – Guide investors in selecting profitable regions for future projects.
This dashboard provides a powerful visual representation of investment trends, aiding in data-driven decision-making for stakeholders across various industries. 🎯📊
Charts and maps are derived from data from the United States Department of Agriculture (USDA) for rural investment programs from 2012-2024. Specific details can be found in the June 2024 Newsletter on our Bimonthly Newsletter page.