Annual GDP Growth Rate by County in the NCT Region (Interactive by Year)
Brief Summary
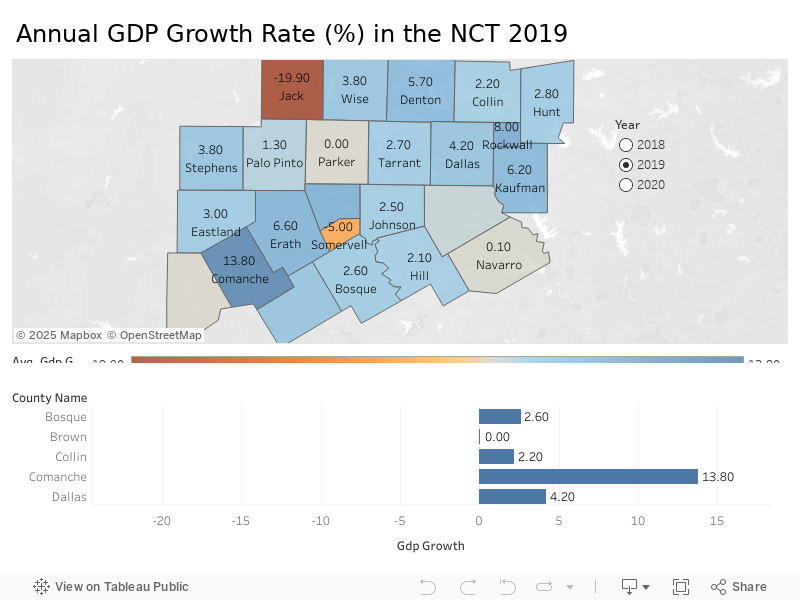
This interactive dashboard presents the annual GDP growth rate (%) for each of the 24 counties in the North Central Texas (NCT) region, with the ability to filter and visualize data by year (2018 to 2021).
Key Features:
- The map visualization uses color-coded gradients to show positive and negative growth rates across counties for the selected year.
- The bar chart below the map provides a detailed numeric comparison of GDP growth rates for each county.
- Users can switch between 2018, 2019, 2020, and 2021 using the year filter to observe changes in regional economic growth over time.
Highlights (2021 example):
- Collin County recorded the highest GDP growth rate of 8.70%, indicating robust economic performance.
- Comanche County experienced the lowest GDP growth rate at -5.50%, reflecting a contraction in local economic activity.
- Other high-growth counties include Denton (8.20%), Rockwall (8.10%), and Dallas (6.60%).
Purpose and Utility:
- The dashboard allows economic planners, local authorities, and analysts to track annual economic health across the region.
- Year-over-year comparisons help in understanding economic resilience and recovery patterns and in identifying counties that may require focused economic development support.
- This tool supports data-driven decision-making for resource allocation, policy formulation, and investment targeting.