Average Wage by Industry Across 24 North Central Texas (NCT) Counties (2013–2023)
This interactive dashboard visualizes median annual wages by industry for each of the 24 counties in the North Central Texas (NCT) region, covering a 10-year period from 2013 to 2023. It offers a powerful tool for analyzing labor market trends, economic health, and income disparities across sectors and geographies.
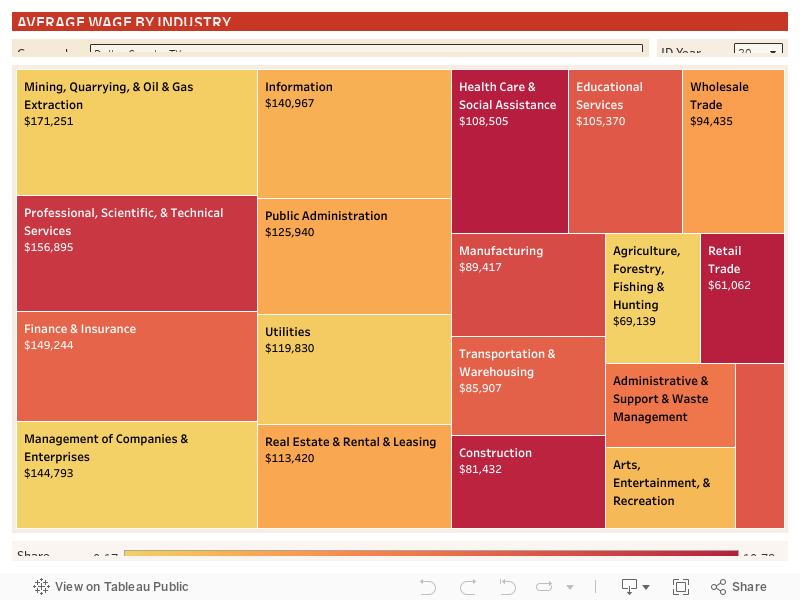
Key Visual: Treemap
- Each block represents an industry and is sized by its share of total employment in the selected county and year.
- Color intensity reflects relative median earnings, helping users instantly compare income levels across industries.
- The dashboard updates dynamically based on year and county selection.
Detailed Industry Insights (example: Dallas County, 2022):
Each industry tile includes:
- Industry Name
- Median Annual Earnings (e.g., Mining, Quarrying, Oil & Gas Extraction: $171,251)
- Share of Total Employment (e.g., 0.43%)
- Total Workforce Size (e.g., 5,624 workers)
- Workforce Growth from previous year (e.g., +2.52%)
- Median Earnings Growth (e.g., +8.46%)
Top-Paying Industries:
- Mining, Quarrying, Oil & Gas Extraction: $171K
- Professional, Scientific & Technical Services: $156K
- Finance & Insurance: $149K
- Management of Companies & Enterprises: $144K
- Information: $140K
These sectors indicate where high-skilled, high-paying jobs are concentrated.
Lower-Paying Sectors:
- Retail Trade: $61K
- Arts, Entertainment & Recreation: $59K
- Administrative Support & Waste Mgmt: $60K
These industries employ a large number of workers but often offer lower wages, highlighting potential areas for wage intervention or workforce upskilling.
Interactive Features:
- Year Selector (2013–2023) – Allows users to view how wages, industry share, and growth have changed over time.
- County Selector – Quickly compare wage structures between all 24 NCT counties.
- Tooltips reveal granular data for decision-making, including workforce dynamics and earnings growth per industry.
Use Cases:
- Economic Development Teams can identify high-growth or underperforming sectors by county.
- Policy Makers can monitor wage equality and identify areas for labor investment.
- Workforce Boards can tailor training programs to growing and high-paying industries.
- Researchers and Analysts can study regional wage trends and industrial dynamics over time.