Non-Employer Business Sales ($1,000) Across 24 Counties in the NCT Region (Interactive for 2012–2020)
Comprehensive Dashboard Summary
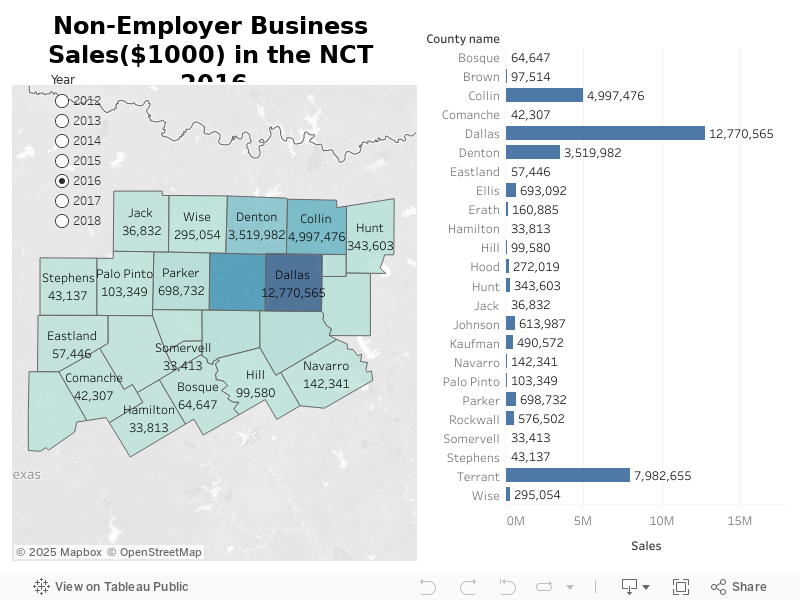
This interactive dashboard provides a county-level analysis of non-employer business sales (in thousands of dollars) across the 24 counties in the North Central Texas (NCT) region, with a dynamic year selection from 2012 to 2020. Non-employer businesses include self-employed individuals, sole proprietors, and micro-businesses that operate without traditional payrolls, playing a critical role in local entrepreneurship and economic resilience.
Key Components of the Dashboard
Geographic Heatmap (Top View)
- The heatmap illustrates county-level non-employer business sales, with darker shades indicating higher sales activity.
- It allows users to visually compare economic vitality and small business strength across the region.
- Example from 2017:
- Dallas County is the dominant hub with sales of $13,379,513.
- Tarrant ($8,557,399) and Collin ($5,333,022) counties also demonstrate substantial entrepreneurial strength.
- Hamilton County reports the lowest activity at $40,417, highlighting areas with limited micro-business penetration.
Bar Chart (Bottom View)
- The bar chart below complements the map by offering a detailed numeric breakdown of sales per county.
- Users can easily identify top-performing and low-performing counties, allowing for precise benchmarking and analysis.
Key Insights and Economic Implications
1. Urban Economic Dominance:
- Major counties like Dallas, Tarrant, and Collin show extremely high sales figures, reflecting vibrant small business ecosystems driven by population density, business opportunities, and access to infrastructure.
2. Rural Economic Gaps:
- Counties with lower sales figures, such as Hamilton, Jack, and Comanche, highlight rural areas where entrepreneurial activity may be limited due to resource constraints, population size, or lack of business incentives.
3. Year-over-Year Analysis Potential (2012–2020):
- By adjusting the year filter, users can track non-employer business growth trends, market shifts, and resilience over time, especially during economic cycles or disruptive events.
4. Strategic Opportunity Identification:
- Economic development boards, chambers of commerce, and regional investment planners can use this dashboard to:
- Target counties with lower sales for small business development initiatives.
- Support areas with moderate growth through access to funding, microloans, and entrepreneurial training.
- Celebrate and build upon the success of top-performing regions by attracting additional investment and showcasing business-friendly environments.
Conclusion
This dashboard serves as a strategic visualization tool for stakeholders to assess small business health, entrepreneurial dynamics, and regional economic contributions across the NCT region. The ability to switch between years offers a longitudinal perspective, empowering decision-makers to design targeted support strategies and growth policies for non-employer businesses across urban and rural counties alike.