Real GDP Levels ($) by County in the NCT Region (Interactive by Year)
Brief Summary
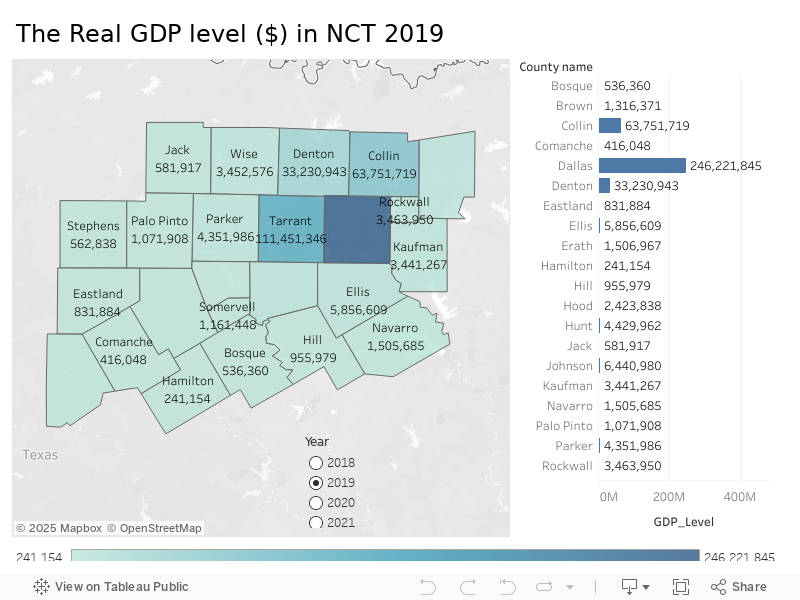
This interactive dashboard provides a county-wise view of the real GDP levels (in dollars) for the 24 counties in the North Central Texas (NCT) region, with the ability to filter and visualize data by year (2018 to 2021). Real GDP measures the value of the goods and services produced by an economy in a specific period, adjusted for price changes.
Key Features:
- Interactive year filter allows users to switch between years and observe changes in real GDP levels across counties.
- The map visualization displays GDP values with color gradients, highlighting counties with higher or lower economic output.
- The accompanying bar chart provides a precise numerical comparison for each county’s GDP in the selected year.
Example (2019):
- Dallas County recorded the highest real GDP at $246,221,845, showcasing its role as the region’s economic center.
- Other top contributors include Tarrant County ($111,451,346) and Collin County ($63,751,719).
- Smaller counties like Hamilton ($241,154) and Comanche ($416,048) reflect limited GDP levels, highlighting economic concentration in larger urban areas.
Usage:
- The dashboard is designed to help economic planners, policymakers, and regional analysts track year-over-year changes in GDP levels.
- It supports strategic decision-making, enabling identification of growth centers and regions that may benefit from targeted economic initiatives.
- The year-over-year analysis makes it easy to observe trends, expansions, or contractions in regional economic performance.